
Police recorded 14,757 crimes in Bromley from April to September 2026, 4.6% more than a year before. Chislehurst rose most. Updated November 2026.
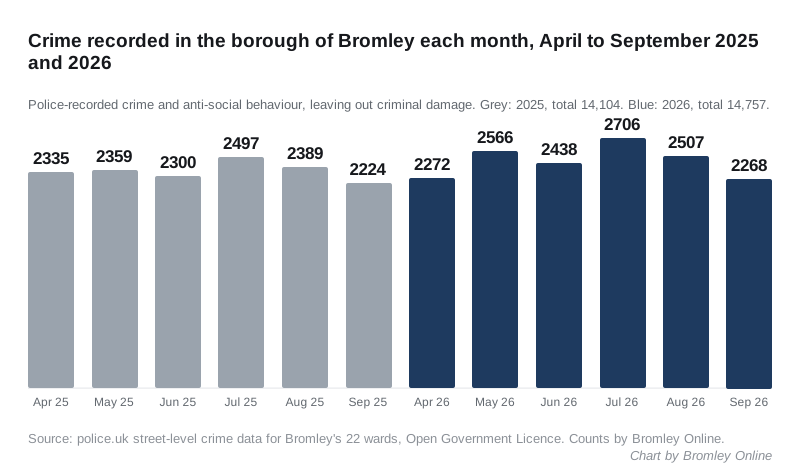
Police recorded 14,757 crimes in the borough of Bromley between April and September 2026. That is 653 more than in the same six months of 2025, a rise of 4.6 per cent.
It comes as a council report says crime fell over the previous year. The Safer Bromley Partnership update records 23,818 crimes in Bromley in 2025/26. That was 1.7 per cent fewer than the year before. The report says Bromley had the seventh lowest crime rate in London. It goes to the council’s Public Protection and Enforcement scrutiny committee on Thursday 19 November.
Our six-month figures are Bromley Online’s own counts from the Home Office’s police.uk open data. We added up every crime and anti-social behaviour report placed inside each of the borough’s 22 wards. September 2026 is the newest month police.uk has published.
The two totals are different measures. Police.uk counts anti-social behaviour incidents alongside crimes, and the council report does not say exactly how its 23,818 was counted. What the police.uk data does show is the direction since April, and it is up.
The busiest summer in two years
July 2026 had 2,706 reports, the highest month in the two years of data we counted. May had 2,566 and August 2,507. Each was higher than the same month in 2025.
September on its own was close to last year. It had 2,268 reports, against 2,224 in September 2025.
Over the full 12 months to September 2026, the count was 27,815. That is 1.4 per cent more than the 27,440 in the year before.
What rose and what fell
These are the April to September figures for each type of crime, 2025 against 2026:
| Type of crime | Apr to Sep 2025 | Apr to Sep 2026 | Change |
|---|---|---|---|
| Anti-social behaviour | 3,068 | 3,284 | up 216 |
| Violence and sexual offences | 3,850 | 4,061 | up 211 |
| Public order | 954 | 1,077 | up 123 |
| Shoplifting | 1,470 | 1,539 | up 69 |
| Other theft | 937 | 981 | up 44 |
| Vehicle crime | 1,666 | 1,709 | up 43 |
| Burglary | 554 | 591 | up 37 |
| Other crime | 171 | 185 | up 14 |
| Possession of weapons | 82 | 87 | up 5 |
| Bicycle theft | 86 | 73 | down 13 |
| Drugs | 625 | 609 | down 16 |
| Robbery | 328 | 295 | down 33 |
| Theft from the person | 313 | 266 | down 47 |
Anti-social behaviour and violence account for most of the rise. With anti-social behaviour taken out, the total still rose by 4.0 per cent, from 11,036 to 11,473.
The council report says anti-social behaviour “remains a significant concern for residents”. It records 5,596 reports in the calendar year 2025, and notes that one incident can be reported to more than one agency.
Chislehurst rose most
Chislehurst had the biggest rise of any ward, up 29.5 per cent, from 437 reports to 566. Shoplifting there went from 42 to 75, and vehicle crime from 65 to 93.
West Wickham was second, up 23.4 per cent. Shoplifting rose from 51 to 80. Our August figures showed how most of the ward’s shoplifting sits on one car park point near the High Street, and that pattern has not changed.
Farnborough and Crofton rose by 18.6 per cent. Police.uk places 137 of its reports since April on a single point labelled “Hospital”. Its map points are approximate, so that is a location on the map, not a finding about the hospital.
Seven wards fell. Shortlands and Park Langley and Penge and Cator had the biggest falls, both by about a tenth.
| Ward | Apr to Sep 2025 | Apr to Sep 2026 | Change |
|---|---|---|---|
| Chislehurst | 437 | 566 | up 29.5% |
| West Wickham | 304 | 375 | up 23.4% |
| Petts Wood and Knoll | 376 | 451 | up 19.9% |
| Farnborough and Crofton | 554 | 657 | up 18.6% |
| Biggin Hill | 360 | 411 | up 14.2% |
| Hayes and Coney Hall | 346 | 394 | up 13.9% |
| Chelsfield | 200 | 225 | up 12.5% |
| Beckenham Town and Copers Cope | 795 | 888 | up 11.7% |
| Kelsey and Eden Park | 688 | 755 | up 9.7% |
| Bromley Town | 1,697 | 1,834 | up 8.1% |
| Darwin | 171 | 182 | up 6.4% |
| Plaistow | 513 | 541 | up 5.5% |
| St Paul’s Cray | 1,163 | 1,214 | up 4.4% |
| Orpington | 695 | 722 | up 3.9% |
| Clock House | 518 | 529 | up 2.1% |
| St Mary Cray | 951 | 947 | down 0.4% |
| Crystal Palace and Anerley | 806 | 793 | down 1.6% |
| Mottingham | 631 | 610 | down 3.3% |
| Bromley Common and Holwood | 699 | 669 | down 4.3% |
| Bickley and Sundridge | 436 | 411 | down 5.7% |
| Penge and Cator | 1,381 | 1,241 | down 10.1% |
| Shortlands and Park Langley | 383 | 342 | down 10.7% |
How to read these figures
- Criminal damage is left out of every total. The Met’s published figures for it fell from between 133 and 269 a month to about 10 a month from May 2026. September 2026 shows 9. That looks like a gap in what the Met sends to police.uk, not a real fall, and our August figures explain it in full.
- Police.uk places each crime on an approximate map point. A crime near a ward edge can land in the neighbouring ward.
- These are recorded crimes. A rise can mean more crime, more reporting or more police activity.
What it means for you
- Check your own street. The police.uk crime map shows the latest month for any postcode, along with your Safer Neighbourhood Team and its priorities.
- Report anti-social behaviour as well as crime. The council report says resident feedback is weighed alongside crime data when the partnership sets its priorities.
- To report a crime, call 101 or use the Met’s online reporting. In an emergency, call 999.
Sources
- police.uk open data API: street-level crimes and Metropolitan Police neighbourhood boundaries for Bromley’s 22 wards, October 2024 to September 2026, Open Government Licence. All counts and percentages are Bromley Online’s own, drawn from that data on 15 November 2026.
- Safer Bromley Partnership Update, report ES20617 to the Public Protection and Enforcement Policy Development and Scrutiny Committee, 19 November 2026.
Have your say