
The average Bromley home sold for £525,000 in May 2026 (Land Registry). Prices by type, the priciest corners, and how the borough dodged the London dip.
If you own a home in the borough of Bromley, or you are trying to buy one, the question is always the same: what are houses here actually worth right now? Asking prices in agents’ windows tell you what sellers hope for. The figure that matters is what homes genuinely change hands for, which HM Land Registry records once every sale completes. This is a plain read of those numbers for 2026: the borough average, which way it is moving, what each property type costs, where the expensive corners are, and how Bromley sits against London and England.
The headline figure for 2026
The average home in the borough of Bromley sold for £525,000 in May 2026. That is the provisional figure from the official UK House Price Index, which is built from completed Land Registry sales rather than asking prices.
Prices were up just 0.2% over the twelve months to May 2026, so the Bromley market is essentially flat in cash terms. What makes that mildly remarkable is the backdrop: over the same year, the average price across London as a whole fell 3.7%. Bromley holding steady while the capital slipped is the quiet story in this year’s numbers, and it fits the borough’s usual pattern, more family houses and fewer of the central-London flats that have been falling hardest.
One caution on other numbers you will see. Portal averages for “Bromley” often cover the BR postcode area, which is not the same as the borough, and they skew to whatever happened to sell that year. Plumplot’s BR-postcode average, for instance, is £571,000 for the year to June 2026. Both figures are real; they just measure different areas, so always check what a number covers before comparing.
What it means for you
If you are selling, a flat market means buyers are price-sensitive and slow to overpay. Realistic pricing from the start tends to sell; chasing a 2022 figure tends to sit. If you are buying, you are not fighting the frenzied competition of a rising market, and flats in particular have cheapened slightly over the year. It is worth checking the council tax band on any home you view, since that yearly bill is a running cost buyers routinely overlook. If you are staying put, your home has held its value over the past year while much of London drifted down, which counts as a good result.
Prices by property type
The borough average hides a very wide spread. These are the Bromley averages for May 2026 from the UK House Price Index:
- Detached houses: about £1,086,000. Flat on the year, and now firmly a seven-figure purchase.
- Semi-detached houses: about £669,000. Up 1.6% over the year, the strongest performer.
- Terraced houses: about £495,000. Up 1.5%, and sitting closest to the borough average.
- Flats and maisonettes: about £312,000. Down 1.8% over the year, the one category to soften.
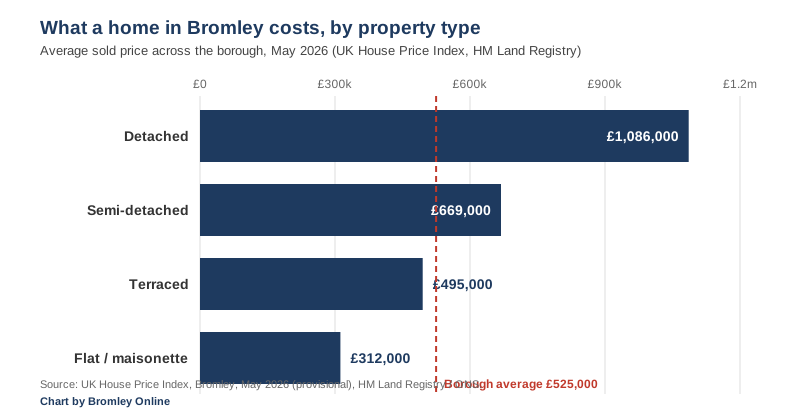
The pattern is the same one running across outer London: houses with gardens are holding or edging up, flats are drifting down, partly because flat buyers are the most exposed to mortgage costs and partly because demand has tilted toward space since 2020.
First-time buyers and home movers
The same data splits buyers in a useful way. A first-time buyer in Bromley paid an average of £402,000 in May 2026. A home mover, someone selling one property to buy another, paid an average of £668,000. The gap between those two figures is, in effect, the size of the step from a first flat or terrace to a family house in this borough.
The priciest corners, and the cheaper ones
Bromley is London’s largest borough by area, and it behaves like several markets in one. Sold-price averages for the last year from Rightmove put the top of the market firmly on the borough’s greener southern and eastern edges:
- Keston: about £961,000 overall, with detached homes averaging £1,287,000.
- Bickley: about £706,000 overall, detached homes around £1,108,000.
- Chislehurst: about £688,000 overall, detached homes around £1,168,000.
At the other end, Penge averaged about £458,000, with flats there around £339,000, and the cheapest postcode sector in the BR area is BR5 3, on the St Mary Cray side of Orpington, at roughly £381,000 (Plumplot). The rule of thumb holds across the borough: prices climb as you move south and east toward the Green Belt, and ease as you move north and west toward the denser, flat-heavy neighbourhoods nearer central London.
How Bromley compares to London and England
| Area | Average price | Change over 12 months |
|---|---|---|
| Borough of Bromley | £525,000 | +0.2% |
| London | £545,000 | −3.7% |
| England | £292,000 | +2.3% |
Bromley now sits only a whisker below the all-London average, a gap that narrowed sharply this year as inner London fell and Bromley did not. Against the rest of the country the borough remains expensive: the average Bromley home costs about £233,000 more than the England average. Fast trains to Victoria and the City, well-regarded schools and the run of parks and Green Belt on the borough’s edge keep demand steady even in a soft market.
Frequently asked questions
What is the average house price in Bromley?
The average home in the borough of Bromley sold for £525,000 in May 2026, according to the provisional UK House Price Index built from HM Land Registry sales. That covers all property types across the whole borough, from Penge to Biggin Hill.
Are Bromley house prices going up or down in 2026?
They are essentially flat: up 0.2% in the year to May 2026. That is a better result than London as a whole, which fell 3.7% over the same year. Flats were Bromley’s soft spot, down 1.8%, while semi-detached and terraced houses edged up around 1.5%.
How much is a detached house in Bromley?
A detached house in the borough averaged about £1,086,000 in May 2026, and more in the priciest areas: Rightmove’s sold-price data puts the detached average in Keston at about £1,287,000 and in Chislehurst at about £1,168,000 over the last year.
Where is cheapest to buy in the borough of Bromley?
The north-western corner. Penge averaged about £458,000 over the last year, with flats around £339,000, and postcode sector BR5 3 near St Mary Cray is the cheapest in the BR area at roughly £381,000. Flats and maisonettes borough-wide average about £312,000.
Is Bromley more expensive than the rest of London?
Bromley’s £525,000 average now sits just below the all-London figure of about £545,000, but the comparison is closing: London fell 3.7% over the year while Bromley held flat. Against England’s £292,000 average, Bromley is expensive.
Where can I check what a specific house sold for?
Every completed sale in England and Wales is public. You can look up a street or a single address free on the HM Land Registry Price Paid service, or browse the same data on Rightmove and Zoopla.
Sources
- UK House Price Index, Bromley (ONS / HM Land Registry) for the borough average, property-type and buyer-type figures.
- UK House Price Index open data (HM Land Registry) for the London and England May 2026 comparisons.
- Rightmove sold prices: Keston, Bickley, Chislehurst and Penge for last-year area averages.
- Bromley house prices (Plumplot, from Land Registry data) for the BR postcode-area average and sector extremes.
- HM Land Registry Price Paid search to check any individual address.
Figures are provisional and revised as more sales complete. Always confirm the latest numbers against the linked HM Land Registry and ONS sources before making a decision. Our other local guides cover Bromley council tax bands, parking in Bromley and Bromley bin collection days.
Have your say