
Bromley crime was flat in the year to August 2026, but West Wickham shoplifting nearly tripled and Bromley Town drug offences rose 64%. Every ward ranked.
Police recorded 27,771 crimes across the borough of Bromley in the 12 months to August 2026, leaving out criminal damage. That is 254 more than in the year before, a rise of 0.9 per cent. In other words, the total barely moved.
Underneath that flat total, two places changed sharply. Shoplifting in West Wickham nearly tripled, from 46 reports to 132. In Bromley Town, drug offences rose by almost two thirds.
These are our own counts from the Home Office’s police.uk open data. It publishes every crime the Metropolitan Police records, placed on a map. We added up every report inside the boundary of each of Bromley’s 22 wards for the 24 months from September 2024 to August 2026. August 2026 is the newest month police.uk has published.
Why criminal damage is left out
The Met’s published data for criminal damage and arson almost disappears from May 2026. Across the borough it ran at between 133 and 269 reports a month until April 2026. From May it drops to 9 or 10 a month.
| Month | Criminal damage and arson recorded in Bromley |
|---|---|
| March 2026 | 173 |
| April 2026 | 150 |
| May 2026 | 9 |
| June 2026 | 9 |
| July 2026 | 10 |
| August 2026 | 10 |
The same drop shows in Lewisham, which points to a gap in what the Met has sent to police.uk, not a sudden end to vandalism. Police.uk’s changelog carries no note about it. Counted as published, criminal damage would show a 40 per cent fall, and the borough total a 2.1 per cent fall. Neither would be real, so every total and ward figure below leaves criminal damage out of both years.
What went up, and what went down
| Type of crime | Year to Aug 2025 | Year to Aug 2026 | Change |
|---|---|---|---|
| Violence and sexual offences | 7,482 | 7,740 | up 3.4% |
| Anti-social behaviour | 5,522 | 5,751 | up 4.1% |
| Vehicle crime | 3,342 | 3,461 | up 3.6% |
| Shoplifting | 3,072 | 2,783 | down 9.4% |
| Other theft | 1,919 | 1,884 | down 1.8% |
| Public order | 1,738 | 1,835 | up 5.6% |
| Burglary | 1,357 | 1,255 | down 7.5% |
| Drugs | 1,152 | 1,202 | up 4.3% |
| Robbery | 615 | 627 | up 2.0% |
| Theft from the person | 685 | 554 | down 19.1% |
| Other crime | 346 | 374 | up 8.1% |
| Possession of weapons | 134 | 175 | up 30.6% |
| Bicycle theft | 153 | 130 | down 15.0% |
| Total (excluding criminal damage) | 27,517 | 27,771 | up 0.9% |
The changes worth knowing about:
- Possession of weapons rose by almost a third, from 134 to 175. It is a small number, and one that depends partly on how often police stop and search people.
- Theft from the person fell by a fifth, from 685 to 554. That is pickpocketing and snatch theft, and most of the fall was in Bromley Town.
- Shoplifting fell by 9.4 per cent across the borough, even as it nearly tripled in one ward.
- Burglary fell by 102 reports, to 1,255.
- Violence and sexual offences remain the largest category, at 7,740 reports, up 3.4 per cent.
August on its own saw 2,507 crimes recorded, leaving out criminal damage. That is 4.9 per cent more than in August 2025, when the figure was 2,389.
West Wickham: shoplifting nearly tripled
West Wickham had the borough’s biggest rise. Recorded crime in the ward went from 553 to 711, up 28.6 per cent.
Most of that was shoplifting, which went from 46 reports to 132. Vehicle crime also rose, from 95 to 136.
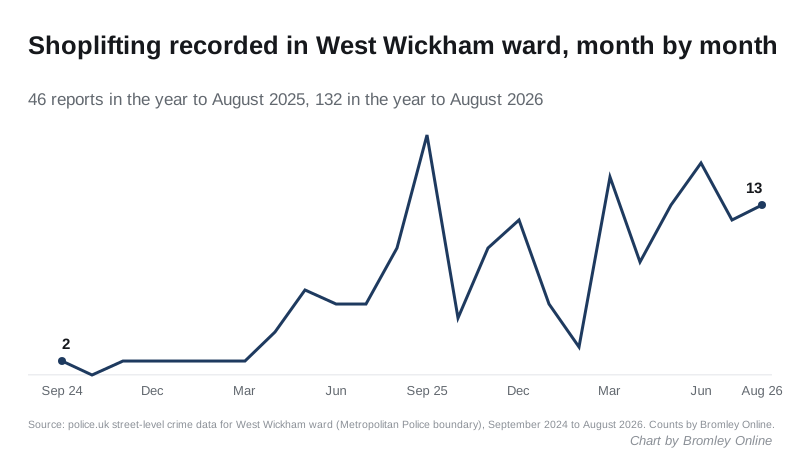
The rise is concentrated in one place. Police.uk places each crime on an approximate map point rather than an exact address. Of the 132 shoplifting reports in the latest year, 72 sit on a single point, labelled “Parking Area”, just east of the High Street. Another 29 are on a second car park point nearby, and 20 on the High Street itself.
So this is not shoplifting spreading through West Wickham’s streets. It is a small number of shops reporting far more of it, from the late summer of 2025 onwards. The data cannot tell us whether that is more theft, more reporting by a retailer, or both.
Bromley Town: drugs up, pickpocketing down
Bromley Town, which takes in the High Street and The Glades, records more crime than any other ward. It logged 3,549 reports in the year to August 2026, about one in eight of the borough total, and up 8.6 per cent. Busy town centres always top these tables, because that is where people shop, travel and go out.
The mix inside the ward changed:
- drug offences up from 151 to 248, a 64 per cent rise
- anti-social behaviour up from 498 to 621
- public order offences up from 258 to 326
- theft from the person down from 234 to 160
A rise in recorded drug offences usually means more police activity, not more drug use. Drug offences are mostly found by officers rather than reported by the public.
The ward was the scene of the High Street stabbing on 10 September, which falls outside these figures. Our report on that incident has the Met’s statements.
Every ward, ranked by change
All figures leave out criminal damage, for the reason above.
| Ward | Year to Aug 2025 | Year to Aug 2026 | Change |
|---|---|---|---|
| West Wickham | 553 | 711 | up 28.6% |
| Chislehurst | 871 | 1,003 | up 15.2% |
| Clock House | 925 | 1,027 | up 11.0% |
| Hayes and Coney Hall | 673 | 740 | up 10.0% |
| Bromley Town | 3,267 | 3,549 | up 8.6% |
| Orpington | 1,260 | 1,339 | up 6.3% |
| St Paul’s Cray | 2,043 | 2,139 | up 4.7% |
| Darwin | 334 | 349 | up 4.5% |
| Petts Wood and Knoll | 826 | 851 | up 3.0% |
| Beckenham Town and Copers Cope | 1,617 | 1,658 | up 2.5% |
| Chelsfield | 454 | 453 | down 0.2% |
| Kelsey and Eden Park | 1,422 | 1,417 | down 0.4% |
| Mottingham | 1,257 | 1,237 | down 1.6% |
| Bickley and Sundridge | 839 | 816 | down 2.7% |
| St Mary Cray | 1,888 | 1,809 | down 4.2% |
| Plaistow | 1,065 | 1,012 | down 5.0% |
| Biggin Hill | 727 | 689 | down 5.2% |
| Bromley Common and Holwood | 1,400 | 1,324 | down 5.4% |
| Farnborough and Crofton | 1,197 | 1,124 | down 6.1% |
| Shortlands and Park Langley | 717 | 672 | down 6.3% |
| Crystal Palace and Anerley | 1,629 | 1,511 | down 7.2% |
| Penge and Cator | 2,553 | 2,341 | down 8.3% |
Chislehurst had the second-biggest rise, up 15.2 per cent. Vehicle crime there went from 117 to 170 reports, and violence and sexual offences from 230 to 263.
Penge and Cator had the biggest fall, down 8.3 per cent, followed by Crystal Palace and Anerley.
How to read these figures
- Police.uk places every crime on an approximate map point. A crime near a ward edge can be counted in the neighbouring ward.
- These are recorded crimes. A change can mean more crime, more reporting, or more police activity. Drugs and weapons offences are mostly found by police, so they rise when patrols and searches do.
- Ward boundaries are the Met’s neighbourhood boundaries, which match the borough’s 22 wards.
- A small number of crimes each month are published with no location and are not counted here.
What it means for you
- If you run a shop in West Wickham, the data shows how far one site can drive a ward’s figures. Reporting every theft is what puts a location on the police map, and that is what patrols are planned from.
- Check your own street. The police.uk crime map shows the latest month for any postcode, along with your Safer Neighbourhood Team and its priorities.
- To report a crime, call 101 or use the Met’s online reporting. In an emergency, call 999.
Our Bromley house prices guide has the other side of what each part of the borough is like to live in.
Sources
- police.uk open data API: street-level crimes and Metropolitan Police neighbourhood boundaries for Bromley’s 22 wards, September 2024 to August 2026, Open Government Licence. All counts and percentages are Bromley Online’s own, drawn from that data on 2 October 2026.
- police.uk changelog, checked 2 October 2026 for any notice on the Met’s criminal damage data (none found).
Have your say