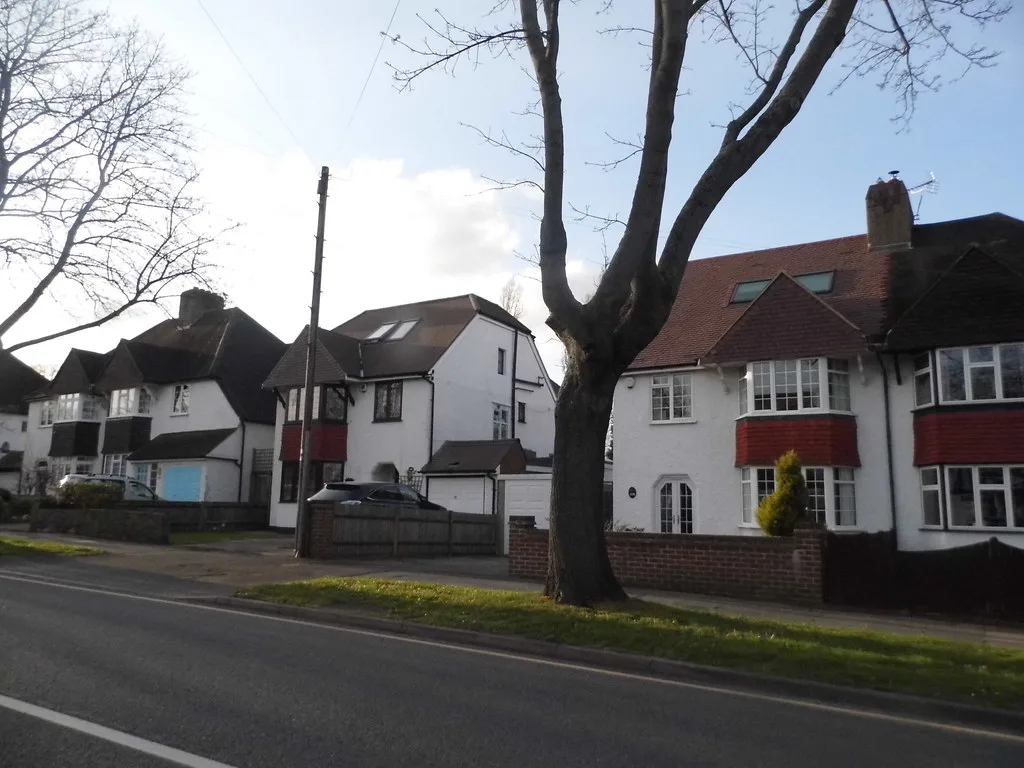

Bromley's average home lost £16,284 in a year, to £511,670 in July. It is the steepest annual fall since May 2024, and flats fell hardest while Bexley rose.
The average home in the borough of Bromley was worth £511,670 in July 2026, down £16,284 on July last year. That is a fall of 3.1 per cent, and it is the steepest annual drop the borough has recorded since May 2024 (HM Land Registry UK House Price Index).
Twelve months ago the same index had Bromley rising at 6.2 per cent a year. The swing from that to minus 3.1 per cent is the story in one line.
Prices have now fallen for three months running: 0.5 per cent in May, 0.6 per cent in June and 0.6 per cent in July.
Where the money went, by property type
Every type of home in the borough is worth less than it was a year ago, but not by the same amount.
| Type | July 2026 | Year change | |
|---|---|---|---|
| Detached | £1,067,151 | -£29,049 | -2.7% |
| Semi-detached | £652,925 | -£12,514 | -1.9% |
| Terraced | £483,699 | -£9,718 | -2.0% |
| Flat or maisonette | £302,447 | -£16,659 | -5.2% |
| First-time buyer | £391,216 | -£13,671 | -3.4% |
Flats took the heaviest hit in percentage terms, and in cash they fell by more than semi-detached houses costing twice as much. The first-time buyer average is down £13,671 in a year, to £391,216.
Bromley is falling while three neighbours rise
This is not a national story. England’s average rose 1.1 per cent over the year. It is a London story, and within London it is uneven.
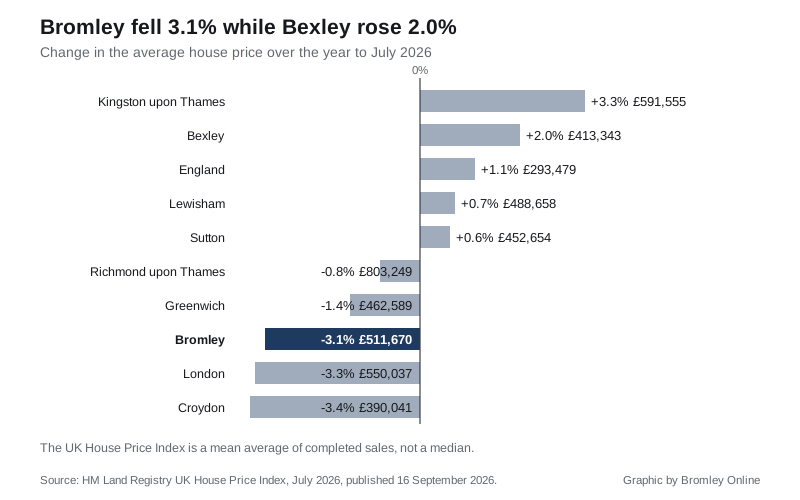
The July figures, by area:
- Kingston upon Thames £591,555, up 3.3 per cent
- Bexley £413,343, up 2.0 per cent
- England £293,479, up 1.1 per cent
- Lewisham £488,658, up 0.7 per cent
- Sutton £452,654, up 0.6 per cent
- Richmond upon Thames £803,249, down 0.8 per cent
- Greenwich £462,589, down 1.4 per cent
- Bromley £511,670, down 3.1 per cent
- London £550,037, down 3.3 per cent
- Croydon £390,041, down 3.4 per cent
Bromley is tracking the London average almost exactly. What it is not tracking is Bexley next door, where the average home gained value over the same twelve months, or Lewisham and Sutton, which both edged up.
That matters for anyone moving between boroughs. A year ago the Bromley average was £122,668 above the Bexley average. It is now £98,327 above it, a gap that has closed by almost a quarter in twelve months.
Three things to know before you use these numbers
It is a mean, not a median. The UK House Price Index averages the whole month’s completed sales, so a handful of expensive detached houses pulls the borough figure up in a way a median would not. Bromley’s detached average of £1,067,151 is doing a lot of work in that £511,670.
It is revised. In August we reported the June average as £518,235. The Land Registry now puts June at £514,567. Each month’s figure can move as late completions are registered, so the most recent months are the least settled.
It lags. The index records sales when they complete and are registered, so July’s figure reflects deals mostly agreed in the spring. It does not tell you what is being agreed now.
What it means for you
- If you are selling, the borough’s asking-price expectations set last summer are roughly £16,000 above what the register is now recording.
- If you are buying a flat, the category has fallen 5.2 per cent in a year, the biggest drop of any type here.
- If you are checking your council tax band against your home’s value, remember the bands are still based on 1 April 1991 values, not today’s. See Bromley council tax bands.
- Our service page, Bromley house prices, carries the longer view, the priciest corners of the borough and how Bromley sits against London. Last month’s figures are in Bromley house prices, June 2026.
- Household budgets are moving too: Bromley’s claimant count rose to 7,295 in August.
- The August 2026 index, covering sales completed last month, is published at 9.30am on Wednesday 21 October.
Sources
- HM Land Registry UK House Price Index, Bromley, July 2026, published 16 September 2026
- UKHPI open data for Bexley, Croydon, Greenwich, Kingston upon Thames, Lewisham, Richmond upon Thames, Sutton, London and England, July 2026, from landregistry.data.gov.uk
Have your say