
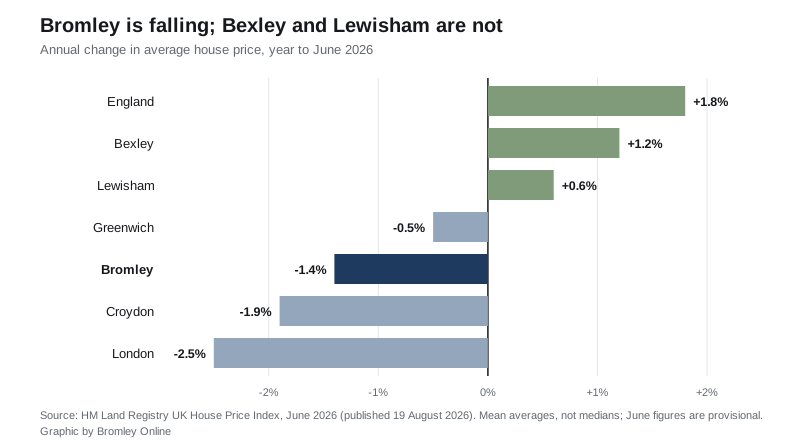
Bromley's average home lost £7,231 in a year, to £518,235. Bexley and Lewisham rose over the same period. The June Land Registry figures, by property type.
The average home in the borough of Bromley sold for £518,235 in June, down £7,231 on a year earlier. That is a fall of 1.4 per cent, and a fall of 1.0 per cent on May alone.
The figures are from the UK House Price Index, published by HM Land Registry on 19 August (HM Land Registry).
The number matters less than the company Bromley is now keeping. For most of the past year the borough held flat while London slipped. It has stopped doing that.
One caveat before any of these figures get quoted. The index is a mean average, not a median. A handful of very expensive sales pull it upward, so it reads higher than the price most people actually pay.
Two neighbours are going the other way
| Area | June 2026 average | Annual change |
|---|---|---|
| London | £553,870 | -2.5% |
| Bromley | £518,235 | -1.4% |
| Lewisham | £491,259 | +0.6% |
| Greenwich | £465,132 | -0.5% |
| Bexley | £405,477 | +1.2% |
| Croydon | £394,736 | -1.9% |
| England | £293,262 | +1.8% |
Bexley is up 1.2 per cent and Lewisham up 0.6 per cent. England as a whole is up 1.8 per cent. Bromley and Croydon are the two falling faster than Greenwich, and only London as a whole is falling faster than either.
The fall is at both ends, not the middle
Split by property type, the year to June divides neatly.
| Property type | June 2026 average | Annual change |
|---|---|---|
| Detached | £1,074,434 | -2.4% |
| Semi-detached | £660,212 | -0.7% |
| Terraced | £488,485 | -0.2% |
| Flat or maisonette | £308,387 | -2.4% |
Terraced houses are essentially unchanged over the year, down 0.2 per cent. Semi-detached houses are close behind. The money has come off the most expensive homes in the borough and off flats, which have been the weak part of this market for two years.
First-time buyers: £396,999, and going nowhere
The first-time buyer average was £396,999 in June, down 1.2 per cent on the year.
Do not read much into it crossing back under £400,000. That figure has sat either side of the line for more than a year, from £394,198 in March to £401,854 in April. Month to month it is drifting, not falling.
A correction to a figure we published
Our Bromley house prices page reported May 2026 as £525,000, rounded, with an annual rise of 0.2 per cent. The June release restates May as £523,271, with an annual change of 0.0 per cent.
That is how this index works. The Land Registry keeps adding completed sales to a month after it first publishes it, so every first release is provisional and small areas move most. We would rather show you the revision than quietly change the old page.
Still below the 2022 peak
Bromley’s highest monthly average in the whole index, which runs back to January 1995, was £529,819 in December 2022. June 2026 sits £11,584 below it, a fall of 2.2 per cent across three and a half years.
In cash terms the borough has gone nowhere since 2022. Set against inflation over the same period, that is a real-terms loss for owners and a real-terms gain for anyone trying to buy in.
What it means for you
If you are selling, the run of flat-to-rising years is over for now, and Bromley no longer outperforms its neighbours. Detached homes and flats are where the softness is. A terrace is holding its value almost exactly.
If you are buying, you are buying into a market where the borough average has fallen for two months running and prices are lower than three and a half years ago. Ask what a property sold for last time; the Land Registry records it, and in this market it is a fair question.
If you are staying put, none of this asks anything of you. It is still worth checking your council tax band is correct, because that bill runs whatever prices do.
The July 2026 index is due at 9.30am on 16 September 2026.
Have your say