
Bromley's average home rose 1.4% in August to £520,253, the biggest monthly rise since March 2025. The yearly fall has shrunk to 0.5%, and semis are up again.
The average home in the borough of Bromley was worth £520,253 in August 2026. That is £7,384 more than in July, a rise of 1.4 per cent in a single month. It is the borough’s biggest monthly rise since March 2025.
The figures come from the HM Land Registry UK House Price Index, published on 21 October.
It ends a run of three monthly falls. The index now has Bromley at 0.2 per cent down in May, 0.6 per cent down in June and 0.5 per cent down in July.
The yearly fall has almost gone
A month ago the borough’s average was down 3.1 per cent on a year earlier. In August it is down 0.5 per cent, or £2,649, on August 2025’s £522,902.
Two things closed the gap:
- August’s own rise of 1.4 per cent.
- A weak comparison month. August 2025 was itself a 1.0 per cent monthly fall, so the year-ago figure being compared against is lower than July 2025’s.
The July figure has also been revised up. We reported it last month as £511,670, down 3.1 per cent. The Land Registry now puts it at £512,869, down 2.9 per cent.
Houses are up on the year, flats are not
Split by type, three of the four kinds of home are now worth the same as or more than a year ago. Flats are the exception.
| Type | August 2026 | Change on August 2025 | |
|---|---|---|---|
| Detached | £1,082,545 | +£211 | 0.0% |
| Semi-detached | £664,931 | +£5,792 | +0.9% |
| Terraced | £493,107 | +£3,357 | +0.7% |
| Flat or maisonette | £306,823 | -£9,184 | -2.9% |
| First-time buyer | £397,470 | -£3,795 | -0.9% |
In July every type was down on the year, with semis at minus 1.9 per cent and terraces at minus 2.0 per cent. Both have now turned positive. Flats have improved from minus 5.2 per cent but are still the weakest part of the market here.
Bromley against its neighbours
Bromley’s 0.5 per cent fall is now milder than London’s, which is down 2.2 per cent. It still trails Bexley next door, up 1.9 per cent.
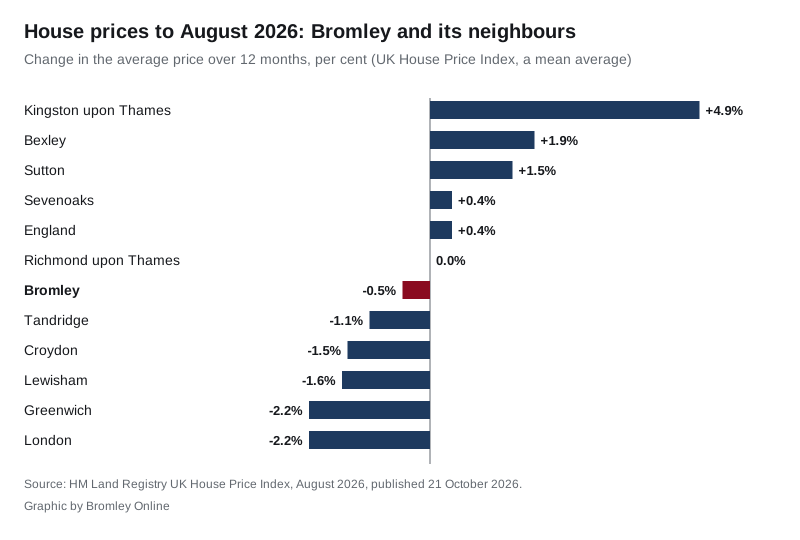
The August averages, and the change on a year earlier:
- Kingston upon Thames £597,587, up 4.9 per cent
- Bexley £414,833, up 1.9 per cent
- Sutton £458,954, up 1.5 per cent
- Sevenoaks £535,810, up 0.4 per cent
- England £293,525, up 0.4 per cent
- Richmond upon Thames £813,931, unchanged
- Bromley £520,253, down 0.5 per cent
- Tandridge £506,774, down 1.1 per cent
- Croydon £396,718, down 1.5 per cent
- Lewisham £486,416, down 1.6 per cent
- Greenwich £462,868, down 2.2 per cent
- London £554,430, down 2.2 per cent
The gap between Bromley and Bexley widened slightly in August, to £105,420. In July it was £98,327 on the figures published then.
Read one month with care
The latest month is the least settled. The index counts sales when they are registered, and late registrations keep arriving for months. July moved by £1,199 in a single revision. A 1.4 per cent jump can shrink, or grow, as more August sales come in.
It is a mean, not a median. The index averages the month’s completed sales, so a few expensive detached homes can lift the borough figure. A median would move less.
It lags. August’s completions were mostly agreed in late spring and early summer. The figure does not say what buyers are offering this autumn.
What it means for you
- If you are selling a house, the register no longer shows Bromley houses worth less than a year ago: semis and terraces are up, detached homes are flat.
- If you are selling a flat, the average is still £9,184 below last August.
- If you are a first-time buyer, the average price paid by first-time buyers is £397,470, down £3,795 on the year.
- Council tax bands are still based on 1 April 1991 values, not today’s. See Bromley council tax bands.
- Our service page, Bromley house prices, has the longer view and how Bromley sits against London. Last month’s figures are in Bromley house prices, July 2026.
Sources
- HM Land Registry UK House Price Index, Bromley, August 2025 to August 2026, published 21 October 2026, and the monthly Bromley series from January 2024, read 23 October 2026
- UKHPI open data for Bexley, Croydon, Greenwich, Kingston upon Thames, Lewisham, Richmond upon Thames, Sutton, Sevenoaks, Tandridge, London and England, August 2026, from landregistry.data.gov.uk
Have your say